Friday, December 19, 2014

Science Fair: Experimental Design

The science fair project hinges on the experiment.  One of the Middle School students, T., wants to compare the burn rate of different types of wood: oak, birch, pine, etc.  My suggestion is to use calorimetry for comparison.  T. will need to make some preliminary tests.  How long does a small piece of wood burn?  T. will need to perform at least three trials for each type of wood tested.  He needs to burn wood chips to practically be able to repeat the trials.

T. also must locate a practical means to compare the burn rate for wood.  A fire pit outside has some drawbacks.  One, T. has to weigh the wood piece before and after the burn or measure the time it burns.  T. identified several, potentially confounding variables, such as wind speed and the outdoor temperature.  Burning wood inside reduces these two confounding variables.  T. might do his experiment in a fireplace and repeat each trial in the same location to reduce the number of confounding variables, things which can skew an experiment.

If T. uses the protocol for the soda can calorimeter, the controlled variables include the volume of water, the type of soda can, the mass of wood, the distance of the soda can above the wood, the type of thermometer, and the room temperature.  Confounding variables may include the soda can ,which is uninsulated, and the fact the wood burns in the open air, rather than in a closed container.  The simpler the design, the better!  The goal is to isolate one independent variable to test and to produce one dependent variable.  In this case, the type of wood determines the number of calories of heat.  (Calories, like joules or BTUs measure the energy content or heat value.). Each trail must be carefully recorded. T. must use 50 mL of water each time and the same mass of wood.  He should record the temperature of the water in the soda can before and after the burn.  The number of calories is determined by Q= m x c x change of temperature or Q, heat equals the mass of the wood x the Spcific heat of water (1 calorie /g degree Celcius) x the overall change in temperature, or the final temperature mupinus the initial temperature, the number of degrees the temperature rises.

Careful design, a minimum of three trials, and attention to detail all craft a good experiment.

Science Fair: Even More Updates

Our school is closing in on Science Fair, set for mid-January.   Now is the time for students to finish the experiments and write research papers.  My kids create slideshow presentations (Keynote, PowerPoint, Google Slides, etc) to help them get organized.  Slideshows allow students to edit, save citations, and make creative changes.  Kids can use templates for the slides and then print them for their display boards.

The content in the research paper is key.  The student should have a complete understanding of the topic.  One of the Middle School students is comparing heat values of different woods.  T. must understand combustion, BTUs, calories, joules, cellulose, hard wood versus soft woods, and the principles of calorimetry.  Students should start by defining every unfamiliar term they encounter as they research.  Next, kids should look up all the formulas and have images or graphics for each molecule or compound.  In this case, wood is composed of cellulose; what is its molecular composition?  It is important to keep track of sources.  One way is to copy and paste links into the Bibliography page in the slideshow or book mark specific pages.  The science textbook may have information; kids tend to overlook this resource.

As students perform the experiment, keep track with photos, creating a photo journal, which includes the materials, observations, changes, etc. T. can assemble a simple calorimetry experiment with a soda can and platform to burn the wood. (Soda Can Calorimeter).   He should photograph every experiment and print a few images for his display.  T. can bring this equipment to the Science Fair as part of the display.  (Chemicals, liquids, and glass are prohibited.).   This brings up another aspect of the research paper.  The student must be able to name every part of the experiment, identify the independent, dependent, controlled and confounding variables, explain the process, discuss the outcomes, and draw conclusions.

With this level of detail and consideration it is time to get a move on!

Monday, December 15, 2014

Science Fair: Research Paper

Where to start?  First, ask the standard questions: who, what, when, where, and why.  Let's look at one project on cell phone radiation.  The student must be well versed on the topic.  What is cell phone radiation?  What is an EMF?  How is it measured?  Why do cell phones emit radiation?  Do land lines emit radiation?  Do cell phones cause cancer?  Is there any research?  Do studies indicate cell phones do or do not cause cancer?  This part of the process is called the literature review.  As the students gleans information relevant to the topic, he or she becomes familiar with issues or the science related to his or her project.

Once the student has some background, this constitutes the first part of the research paper and becomes part of the introduction.  The introduction should include information about the topic?  What is cell phone radiation?  Is it harmful?  What do studies indicate?  The research paper does not have to be lengthy.  The introduction should be at least one paragraph with three to five sentences.  Ask your child to tell you about his or her project and then type up these answers.  Once the student has the thoughts written, it is time for revisions.  Unlike this blog, the paper should be written in the third person, present tense, and active voice.  For example, 'Cell phones emit radiation and the amount of radiation varies.'

Each section of the research paper should be written as paragraphs.  Students may title each paragraph.  See this example.
Materials:
The materials for this experiments include the following: an EMF detector, thirty different cell phones, a field notebook, and a pencil.

Procedures:
The first step in this experiment is to remove any case and to place the cell phone face down on a solid surface.  The next step is to measure EMFs from each cell phone with the detector both 'on' and 'off'.

These sections need not be long-just complete.  Often the entire paper is only two pages.  Judges do want to see the research paper.

Friday, December 12, 2014

Science Fair: Update

All Science Classes
So far, most of the kids have their hypotheses and are researching their projects.  Now is the time to gear up and get moving on the experiments!  The first step is to see if your child is using an idea from a web site, such as sciencebuddies.com; if so, check there for materials and procedures.  If the child has a more original idea, try a web search for materials and procedures.  Often, there are two or three common methods; encourage your child to do some preliminary experiments to see which method produces the best results.  Be sure to take photos as documentation!  Keep a log or field notebook.  However, photos with time and date stamps or videos can comprise an electronic notebook.  In fact, the student may want to create an electronic folder for science fair files.  I encourage kids to use their cell phones to text themselves reminders, notes, and photos.  My kids create slideshow presentations and add slides with references and photos to keep the information together.  It makes things much easier to edit and print for their displays.  The kids can bring laptops and tablets to the Science Fair should they need to consult their notes.  One last tip is to download reference material as pdf files on their computers or tablets.  This way the child will have that reference to work with off line, especially when Internet access is an issue or the wifi is spotty.  The student can consult the references in their electronic file at the Science Fair, too.

Wednesday, December 10, 2014

Science Fair: More on Hypotheses

Let's use the cell phone radiation experiment to help hone the null and alternative hypotheses.  P. And M. are using an inexpensive cell phone EMF meter to measure cell phone radiation.  Their null hypothesis for this experiment is "All cell phones emit the same amount of radiation." Their alternative hypothesis is "Apple cell phone or iPhones emit more radiation than Android cell phones."

Their alternative hypothesis could just as well have been that Android devices emit more radiation than Apple phones.  What happens if all of the cell phones do emit the same amount of data, is their experiment a failure?  No!  Their results may support either the null hypothesis or the alternative hypothesis.  The data may in fact, refute both!  The important thing is to have an idea to test which becomes the hypothesis!

Science Fair Experimentation

One of the biggest misconceptions kids have about their projects is that unless everything goes perfectly, it has failed.  This morning, some of the kids started to collect data for their experiments.  L. and D. had the idea to build batteries, a fine exoeriement for middle school aged students.  They had an experiment from Apologia's Middle School Chemistry and Physics textbook. L. had also performed several electrical experiments in stations last summer at Science Camp, including Squishy Circuits.  L. and D. spent several hours mixing the playdough, sanding pennies, and building circuits with LED bulbs.  They used lemon juice, coffee, potatoes, battery packs, etc.  After an entire morning experimenting, they cheerfully abandoned the project and changed direction altogether because they could not get the experiment to perform according to their expectations, after doing some great science!

Students have trouble seeing that the trial and error, redesign, and frustrations are at the heart of the scientific method. In fact, it makes for good discussion during the child's presentation. I am partially to blame; I select experiments which deliver good results to avoid some of this frustration and angst associated when an experiment does not work well.

L. and D. switched to testing the pH of saliva.  They spent the rest of the morning saturating pieces of water color paper in universal indicator, and drying the paper with a hair dryer.  The two calibrated the paper with lemon juice using the pH color scale in the Apologia textbook.  They will compare their strips with commercial strips.  The two left armed to collect data.  L. and D. Took five minutes, decided how long to leave the strip in a person's mouth, and which questions to ask their participants.

Another pair of students, P. and M. are using an inexpensive cell phone radiation meter to collect data.  They spent the morning doing preliminary testing: type of cell phone, with or without the case, upside down or face up, on or off, texting, playing music, sending or receiving a call, etc.  they were getting mixed data and retested using different sensitivities on the meter.  M. was a little frustrated because the project was open-ended.  The pair tested everyone's cell phones, the land line, the TV, and three old iPods.  I sent them home frustrated with instructions to research EMFs and cell phone radiation.  Do different devices emit varying amount of radiation?  Is the radiation dangerous?  If so, how is it dangerous?  Even if the data from the meter varies, they have a tremendous amount of information to consider as they conduct their project, continue to research the topic and collect more data.


Tuesday, December 9, 2014

WA Science Fair Update

WA: Science Fair Updates
Science Fair is January 13, 2015.
Today students received hard copies of the score sheet, the research paper outline, an article on essays, a set of headers, a sample display guide, and a sample judge's form.  Please check the Blog and Google Classroom for more information.  As students complete any of the components, they should email updates to me for review.   Mrs. Howett will review any essays, too. 

Science Fair Organization

Students struggle to organize their science fair projects.  After all, the process can be daunting, especially for the uninitiated.  This  Presentation may help.  I encourage my classes to start by creating a slideshow presentation which includes the major components of the project.  Some documents, such as the hypothesis or abstract, appear in the research paper and on the display board. The idea is to use the presentation as a notepad to rough in the project to make it easier to edit.  The slide backgrounds and fonts can be adjusted and printed to be used on the display board.  The student can often bring the laptop or tablet to the Science Fair competition to show the judges.

There are a number of free presentation apps, such as Prezi or Google Slides.  The 'Slides' app for iPad is rough and difficult to edit.  I uploaded the presentation I had first created on my iPad and reopened it on my Dell laptop; this slide app is limited in its choice of themes.  There are excellent templates available in Google docs, you may wish to use instead.

Monday, December 8, 2014

Science Fair: What do judges ask?

Every school district, county, and state have their own scoring guide for judges to use to evaluate science fair projects.  Sometimes the judges work in teams, sometimes alone.  The forms tend to be vague.  Creativity?  Just how is that defined?  That aside, the judge will see if the project has a hypothesis, a research paper, an experiment, data, methods, materials, and a conclusion.  Most of the time, when I judge, I ask the student or team to tell me about their project.  Many kids have memorized a script.  I prefer the kid to just start explaining what he or she did, how it turned out, why they selected this project, what happened that was unexpected, or what he or she might do differently next time.  Why did you enjoy this experiement?  What does the data imply?  Did the data support or refute the hypothesis?


Example One
Example Two

Science Fair: Display Backboard


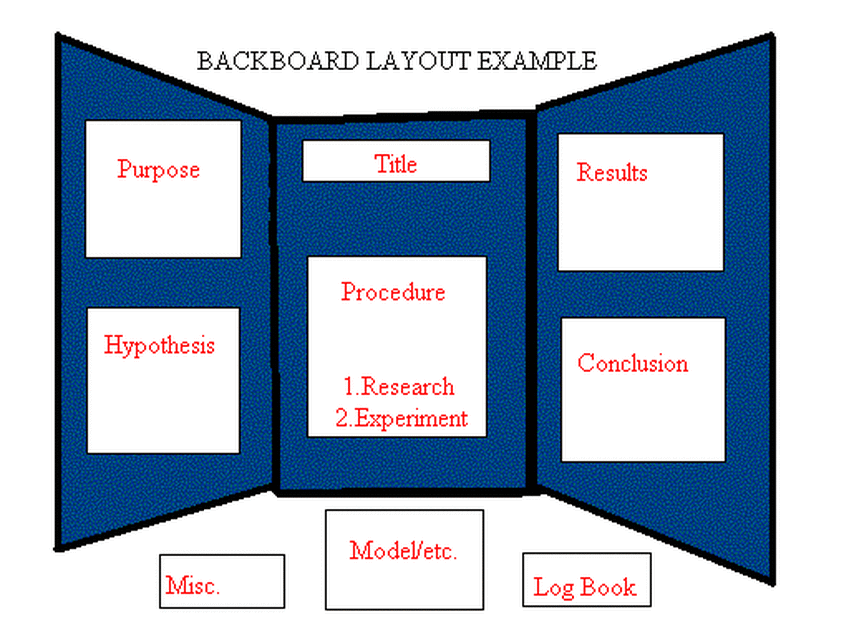
Intel Display Guide is a 45 page presentation explaining how to prepare a display-certainly a very useful presentation if your project makes in to International!  If you look at images of displays, you will notice that there is no consensus as to just what must be on the display.  This Backboard Display example is typical.  The trifold display backboards sold at Walmart or at an office supply store are fine.  Shop around!  Don't spend $12 on a backboard!  Try to locate one for under $5.00.  It is not necessary to buy the tags which say 'Methods' or 'Hypothesis', often called 'headers'.  Just type and print them.  Be sure to have color!  Include photos of the experiment.  Bring a model or any equipment used. (Leave chemicals and glassware at home.) A simple white backboard with construction paper and neatly printed information is fine.  The judges are considering the merits of the project, not the amount of glitter glue or creative use of foam core.  This Display Example has excellent color graphics, typed information, all neatly presented.  The content is more important than its presentation as long as the content is scientifically accurate and the information is well understood by the student.

Science Fair: Title Page

Here is a title page to introduce the research paper.  Some fairs request that the student remove his or her name.   Be sure to check the local guidelines.

Nitrates in the Mill Creek watershed


Nitrates in Mill Creek
Deborah Stevens
Musselman High School


Correspondense regarding this report should be directed to Deborah Stevnens
Chemistry Teacher
Musselman High School
126 Excellence Way
Inwood WV 25428

Science Fair: Research Paper Example

Here is an example of a research paper so students can get an idea of the style required for competition.

  Research Paper Body

Introduction

The null hypothesis for this experiment is that the nitrate levels in Mill Creek (at the public access point tested) will not exceed the safe drinking water standards during the thirty day test period.  The alternative hypothesis for this experiment is that the nitrate levels in Mill Creek (at the public access point tested) will exceed the safe drinking water standards during the thirty day test period.  Nitrates (NO3-) originate in fertilizers, sewage, run-off from farms and residences, faulty septic tanks, and erosion from natural nitrate sources.  Natural water sources contain typically less than one ppm (mg/L) of nitrate/nitrogen (the form measured according to the Environmental Protection Agency (EPA) Clean Water Standards).  The EPA posts “maximum contaminant levels” (MCLs) which include standards for microorganisms, disinfectants, disinfection byproducts, inorganic and organic chemicals, and radionuclides; nitrates are classified as inorganic chemicals.  Nitrate levels in drinking water that exceed 10 mg/L can cause methemoglobinemia or “blue baby syndrome”; infants younger than six months of age are susceptible through contaminated water in bottles or water mixed with baby formula.  The reason young infants are susceptible to “blue baby syndrome” is because their stomach acid is as concentrated as older children and adults.  Bacteria can form in young infants’ stomachs that converts nitrates to nitrites (NO2-), which can be absorbed in the bloodstream, oxidizes iron in the hemoglobin of red blood cells, and forms “methemoglobin.”  Methemogloboinemia describes the condition of a baby with elevated levels of methemoglobin and is potentially fatal; infants may be treated with methylene blue solutions.  Consequently, it is important to monitor nitrate levels in water.

Natural water sources usually contain less than 1mg/L (1ppm) concentration of nitrates and are limited as a resource.  Nitrates are part of the nitrogen cycle and an essential plant nutrient.  In a natural, healthy ecosystem, excessive nitrate levels are seldom a problem.  However, farms, faulty septic systems, and residential neighborhoods can contribute to excessive nutrient run-off into neighboring water systems.  The Chesapeake Bay watershed implicate excessive nutrient run-off (particularly nitrate and phosphate nutrients) as the chief problems  currently confronting the Bay.

Science Fair: Abstract

Here is an example of an abstract.

The Effects of Nitrates on the Mill Creek Watershed

Abstract

Nitrate in Water examines the effect of excess nitrate nutrients in a local stream, Mill Creek, at a public access area in Bunker Hill, Westy Virginia.  The study measures the nitrate levels in the stream over a thirty day period using standard LaMotte test procedures.

Science Fair: Research Paper

Research Paper Outline
Title Page
Name of the Project
Teacher's Name
Centered on letter-sized paper

Abstract
Summary of the Project

My students often struggle to write a research paper.  Here is an outline.  One tip which can help is to begin with presentation slides for each item, beginning with the title.  Students can print the slideshow for their display board.

Research Paper
1. Abstract
2. Introduction
  – Literature review (What is an alcohol rocket car?)
  – Independent Variable
  – Dependent Variable(s )
  – Controlled Variable(s)
  – Confounding Variable(s)
  – Purpose
  – Rationale (Why?)  
  – Hypothesis  
3. Materials
4. Methods or Procedures
5. Results (Data, chart, table, or graph)
6. Discussion
   – Did the experimental data support or refute the hypothesis?
   – Describe the mean, median, and mode.
   – Describe the variance and standard deviation.
7. Conclusion
   – This section explains the findings or what happened.  Did anything unexpected happen?
   – How did your experimental results compare to other researchers'?
   – Can you offer an explanation for the results?
   – Is more study recommended or indicated? (More study is indicated.)
   – Offer ways to improve the experiment next time.
8. Bibliography (Ideally conforming to MLA style)

Science Fair: Step One

Where to begin?  Begin with an idea.  Start with Science Buddies, a terrific site with thousands of ideas.  Once the idea is fixed, it is time to write a hypothesis.  There should be two parts: the null hypothesis and the alternative hypothesis.  Here is an example.


Hypothesis

The null hypothesis for this experiment is that the  average nitrate levels in Mill Creek (at the public access point in Bunker Hill) will not contain exceed safe drinking water standards during the thirty day period of water testing.

The alternative hypothesis for this experiment is that the average nitrate levels in Mill Creek (at the public access point in Bunker Hill) will contain nitrate levels that do    exceed safe drinking water standards during the thirty day period of water testing.

Thursday, December 4, 2014

Apologia Chemistry and Physical Science Labpaqs

One issue Homeschool co-ops and families encounter is access to chemicals.  Home Science Tools is an excellent resource for small quantities of chemicals.  I order materials from Amazon or buy household chemicals at Walmart.  When I worked at a small, private school, there was little in the way of materials.  I learned that the local pharmacy or grocery store had many common chemicals at vastly reduced prices.  I have used household chemicals in labs ever since.  So, how does one determine their formulas?  Some household chemicals, such as Epsom salts, have the formula on the package.  The Illustrated Guide to Household Chemistry has a table of easy to assess chemicals along with fairly complex labs, which have been professionally reviewed.

I accidentally ran across Labpaqs on Shop Good Will, under the heading of small scale labs or lab kits.  I did some research and several colleges and programs use custom kits for distant learning.  The Labpaq kits have goggles and a surprising number of sophisticated materials.  This type of convenience comes at a price; I got a set on Ebay for much less than retail.

In any case, all of the materials our classes have used, with the exception of some vials and test tubes which were donated, originate from Home Science Tools, Amazon, Walmart, or a Labpaq.  We set up lab stations in the garage where the ventilation is good-but, the lighting could use a boost.  I want to encourage the use of small scale labs whenever possible.  Collect cassette cases to hold test-tubes and purchase reaction plates, which only hold small volumes.  We use craft sticks, toothpicks and disposable pipers and toss them to reduce cross contamination.  Small scale labs allow the kids to repeat experiments several times without extra costs or hazards, too.

Apologia Chemistry and Physical Science

The Chemistry class is in the midst of moles.  Two weeks ago they did a lab in which they prepared a series of 1M (one molar or one mole per liter) solutions for the Physical Science class' precipitate lab while the Physical Science class used Flinn's Putting the Ions in Their Hands activity, previously mentioned in earlier blog pages.  Yesterday, the Chemistry kids prepared more solutions for the Physical Science kids.  One of the students had been absent two weeks ago and I wanted him to have this experience.  Besides, two weeks is a long time to remember a relatively new skill; I decided it would be good for them to prepare some more solutions.  The Chem kids made 1M solutions of copper II sulfate, magnesium sulfate (Epson salts), sodium chloride (table salt), potassium chloride (fake table salt), calcium chloride (Driveway Heat), and silver nitrate.  I have small 50 mL vials which were donated.  The kids have to calculate the respective molar masses and then combine 0.1 moles in a total of 100 mL.  The key is to combine the salt with about 50 mL of water in a flask and then add water to make a total of 100 mL of solution.  If the kids measure a volume of 100 mL of water and then add the salt, the total concentration won't be 1 M.  The kids ran into a hitch when they learned there wasn't enough silver nitrate powder to prepare a total of 100 mL and had to set up a proportion to determine how much total volume they could prepare with the amount of silver nitrate they had on hand.  See why I like this lab activity?

Meanwhile, the Physical Science kids were reviewing nomenclature.  Last week, they had used similar solutions to observe precipitates.  This week, I had the kids write the names of the compounds formed when they observed a change.  I added a wrinkle.  We wrote calcium or sulfate instead of
Ca +2or SO4 -2 on the vials.  The kids had to look on their ion charts to determine if the species was a cation or anion.  They were instructed to combine cations with anions.  After they combined the ions, they wrote the names and formulas for the combinations that reacted or changed.  The kids had the idea to write the names on craft sticks next to the reaction plates.

Just as a note, I have been bidding on Labpaq kits on Ebay and Shop Goodwill.  One of the Labpaq kits, LP2598- CK 01 had lead nitrate, extra reaction plates and a small digital scale.  I had purchased
another scale previously.  This one is a fraction of the price.  More on Labpaqs in the next post.

Apologia Chemistry and Physical Science

Here are some photos of the lab.  The next post will explain the set-up and purpose.

Wednesday, December 3, 2014

Science Fair Resources: The Sequel

Science Fair 2015
I like Science Fair: judging, coaching, seeing the final projects, the whole process.  I am the exception.  The reason I promote Science Fair is that it embodies so many of the skills valued by employers and espoused by Common Core standards: public speaking, technical writing, research skills, working as a team, completing a project!  I think every student should do this once.  Here are some steps to getting started.
1.  Start by looking at the local science fair guidelines. Here are the Berkeley County, WV  High School Guidelines and Middle School Guidelines.
2.  Most regional science fair expos follow the Intel rules and use their forms.
3. Once you are familiar with the rules chose a project; try starting with Science Buddies.  Their web site has great suggestions.  Students often ask if using a published idea is cheating.  In science, any experiment must be replicable; so, using a science project idea is fine.  Just don't copy a research paper and be sure to cite the project in your bibliography or work cited page.
4. Once you have an idea, write the hypothesis, which should contain both the null hypothesis and the alternate hypothesis.  Null and Alternative Hypotheses set up the data for statistical analysis.
5. Next is the experiment.  What are you testing?  What are the independent and dependent variables?  Identify the controlled or confounding variable. This you-tube video reviews Types of Variables.
6. The student should design and implement his or her experiment with a minimum of three trials.  It is important to keep good records, take pictures, write notes, date experiments, and jot down sources for the experiment.  Include pictures of the equipment, the student doing the experiment, and results, whenever possible.  This is a good way to document the project.
7.  The research paper can be daunting.  Research paper outline and Research paper sample may help.
8.  Once the experiment has been completed and analyzed, the report written, it is time to assemble the Project Display Board.  Here are some Headers or Headings.  Be sure to add photos and avoid pictures of faces, which may or may not be allowed.  Come up with a colorful title and interesting question.
9.  Usually, an abstract or brief summary of the project should be included with the forms and research paper.  A copy of the abstract may be placed on the display board.
10.  Judging at the Science Fair is easy if the student has done all of this work! When I judge Science Fair projects, I ask kids to tell me about their projects.  The student should think about why he or she selected this project.  Does it have implications for society, like a project on texting?  Did anything surprising happen?  What obstacles were encountered?  What would you do differently next time?  Students may memorize a speech; but, the best presentations are delivered by students invested in their projects.

National Chemistry Week is around the corner. Are you ready?

  National Chemistry Week   (NCW) coincides with  Mole Day!   NCW’s 2026 theme is construction.  My Co-op Chemistry class focuses on Mole Da...